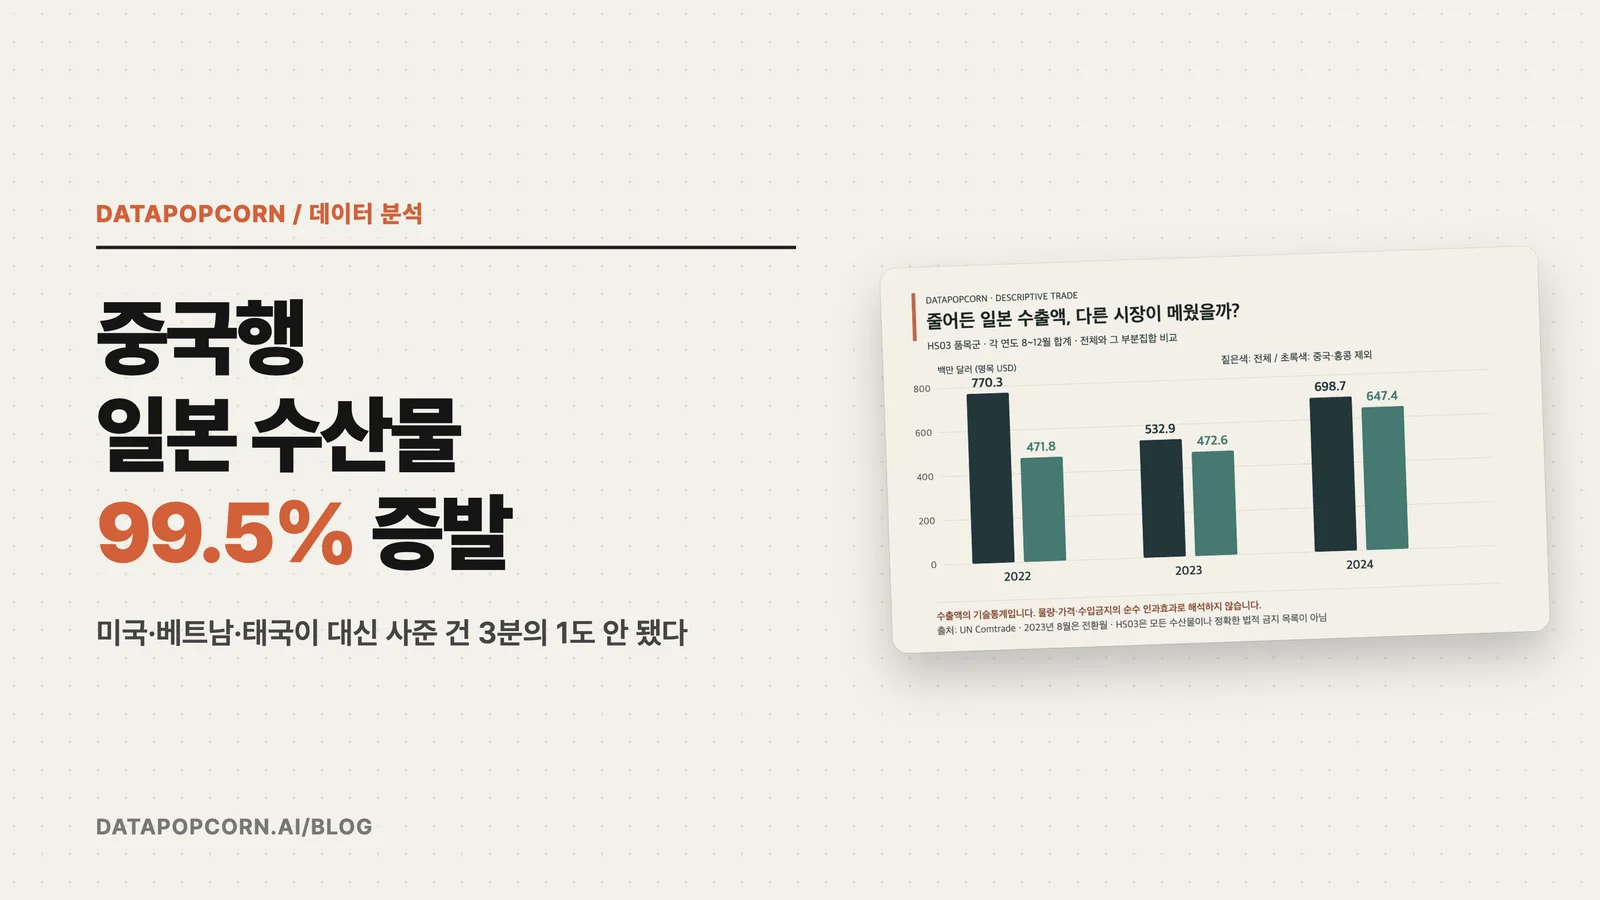
Japan's Seafood Exports to China Vanished by 99.5%. The US, Vietnam and Thailand Picked Up Less Than a Third
In 2022, Japan sold $538.4 million of seafood (HS03) to China. In 2024, reported exports to China came to $2.6 million. 99.5% had vanished. This happened after China halted all seafood imports from Japan on August 24, 2023.
A line you heard a lot back then was "if China won't buy, just sell to other countries." And compared with 2022, in 2024 the US bought $65.84 million more, Vietnam $60.56 million more and Thailand $25.83 million more. That adds up to $152.23 million. But that's less than a third of what was lost from China alone.
The period right after the ban is even more striking. Over the five months from August to December 2023, extra sales to countries other than China and Hong Kong totaled just $0.8 million. That's 0.3% of the $238.17 million that disappeared. I used raw UN trade data to trace how slowly, and how partially, "just sell somewhere else" actually works in the real world.
- For the first five months, the lost exports went practically nowhere. From August to December 2023, exports to China and Hong Kong were $238.17 million lower than in the same months of 2022, while other destinations grew by only $0.8 million. Japan's world exports fell by the same amount, down 30.8%.
- Looking only at the second half a year later, it seems like much of the gap was filled, but on an annual basis it was about one-seventh. From August to December 2024, destinations other than China and Hong Kong were up $175.63 million (+37.2%) from the same months of 2022, covering about 71% of the drop. But across all of 2024, the $81.62 million increase in other destinations was about 14% of the $575.58 million decline in China and Hong Kong, and world exports were 25.3% below 2022.
- So here's how to read it. When a market that took a third of exports was closed off, alternative outlets didn't open right away, and more than a year later most of the gap was still there. It's a measured case showing how slowly, and how partially, the assumption "if one market closes, sell somewhere else" works in reality.
It's HS03, not all seafood
First, we need to narrow down what exactly is being analyzed. HS03 is the HS chapter covering fish, crustaceans, molluscs and other aquatic invertebrates, a classification centered on unprocessed items. So it is not the same as "all seafood" in everyday language. It can also include items that don't line up exactly with live fish or with what is legally banned.
Prepared or preserved fish (HS1604) and prepared or preserved crustaceans and molluscs (HS1605) are separate baskets. I did not add these two baskets to HS03 or merge them into a single all-seafood indicator. Stating up front that the legal ban and the statistical classification may differ keeps the numbers that follow from being overstated as a policy effect.
This analysis covers Japan, exports, monthly, January 2022 through December 2024. For the raw data, I pulled every destination row for Japan plus the World aggregate from the UN Comtrade public preview API. World's partner code 0 is the sum of all destinations, not an additional country, so I did not add it back into the country totals.
Lining up the key results by the same months
China announced its halt on Japanese seafood imports and it took effect on August 24, 2023. Because the measure landed mid-month, August 2023 is a transition month, not a clean pre- or post-period month. Even so, to avoid seasonality, I compared August-December 2022 with August-December 2023, month for month.
In the table below, m means millions of US dollars.
| Destination or total | Aug-Dec 2022 | Aug-Dec 2023 | Change | How to read it |
|---|---|---|---|---|
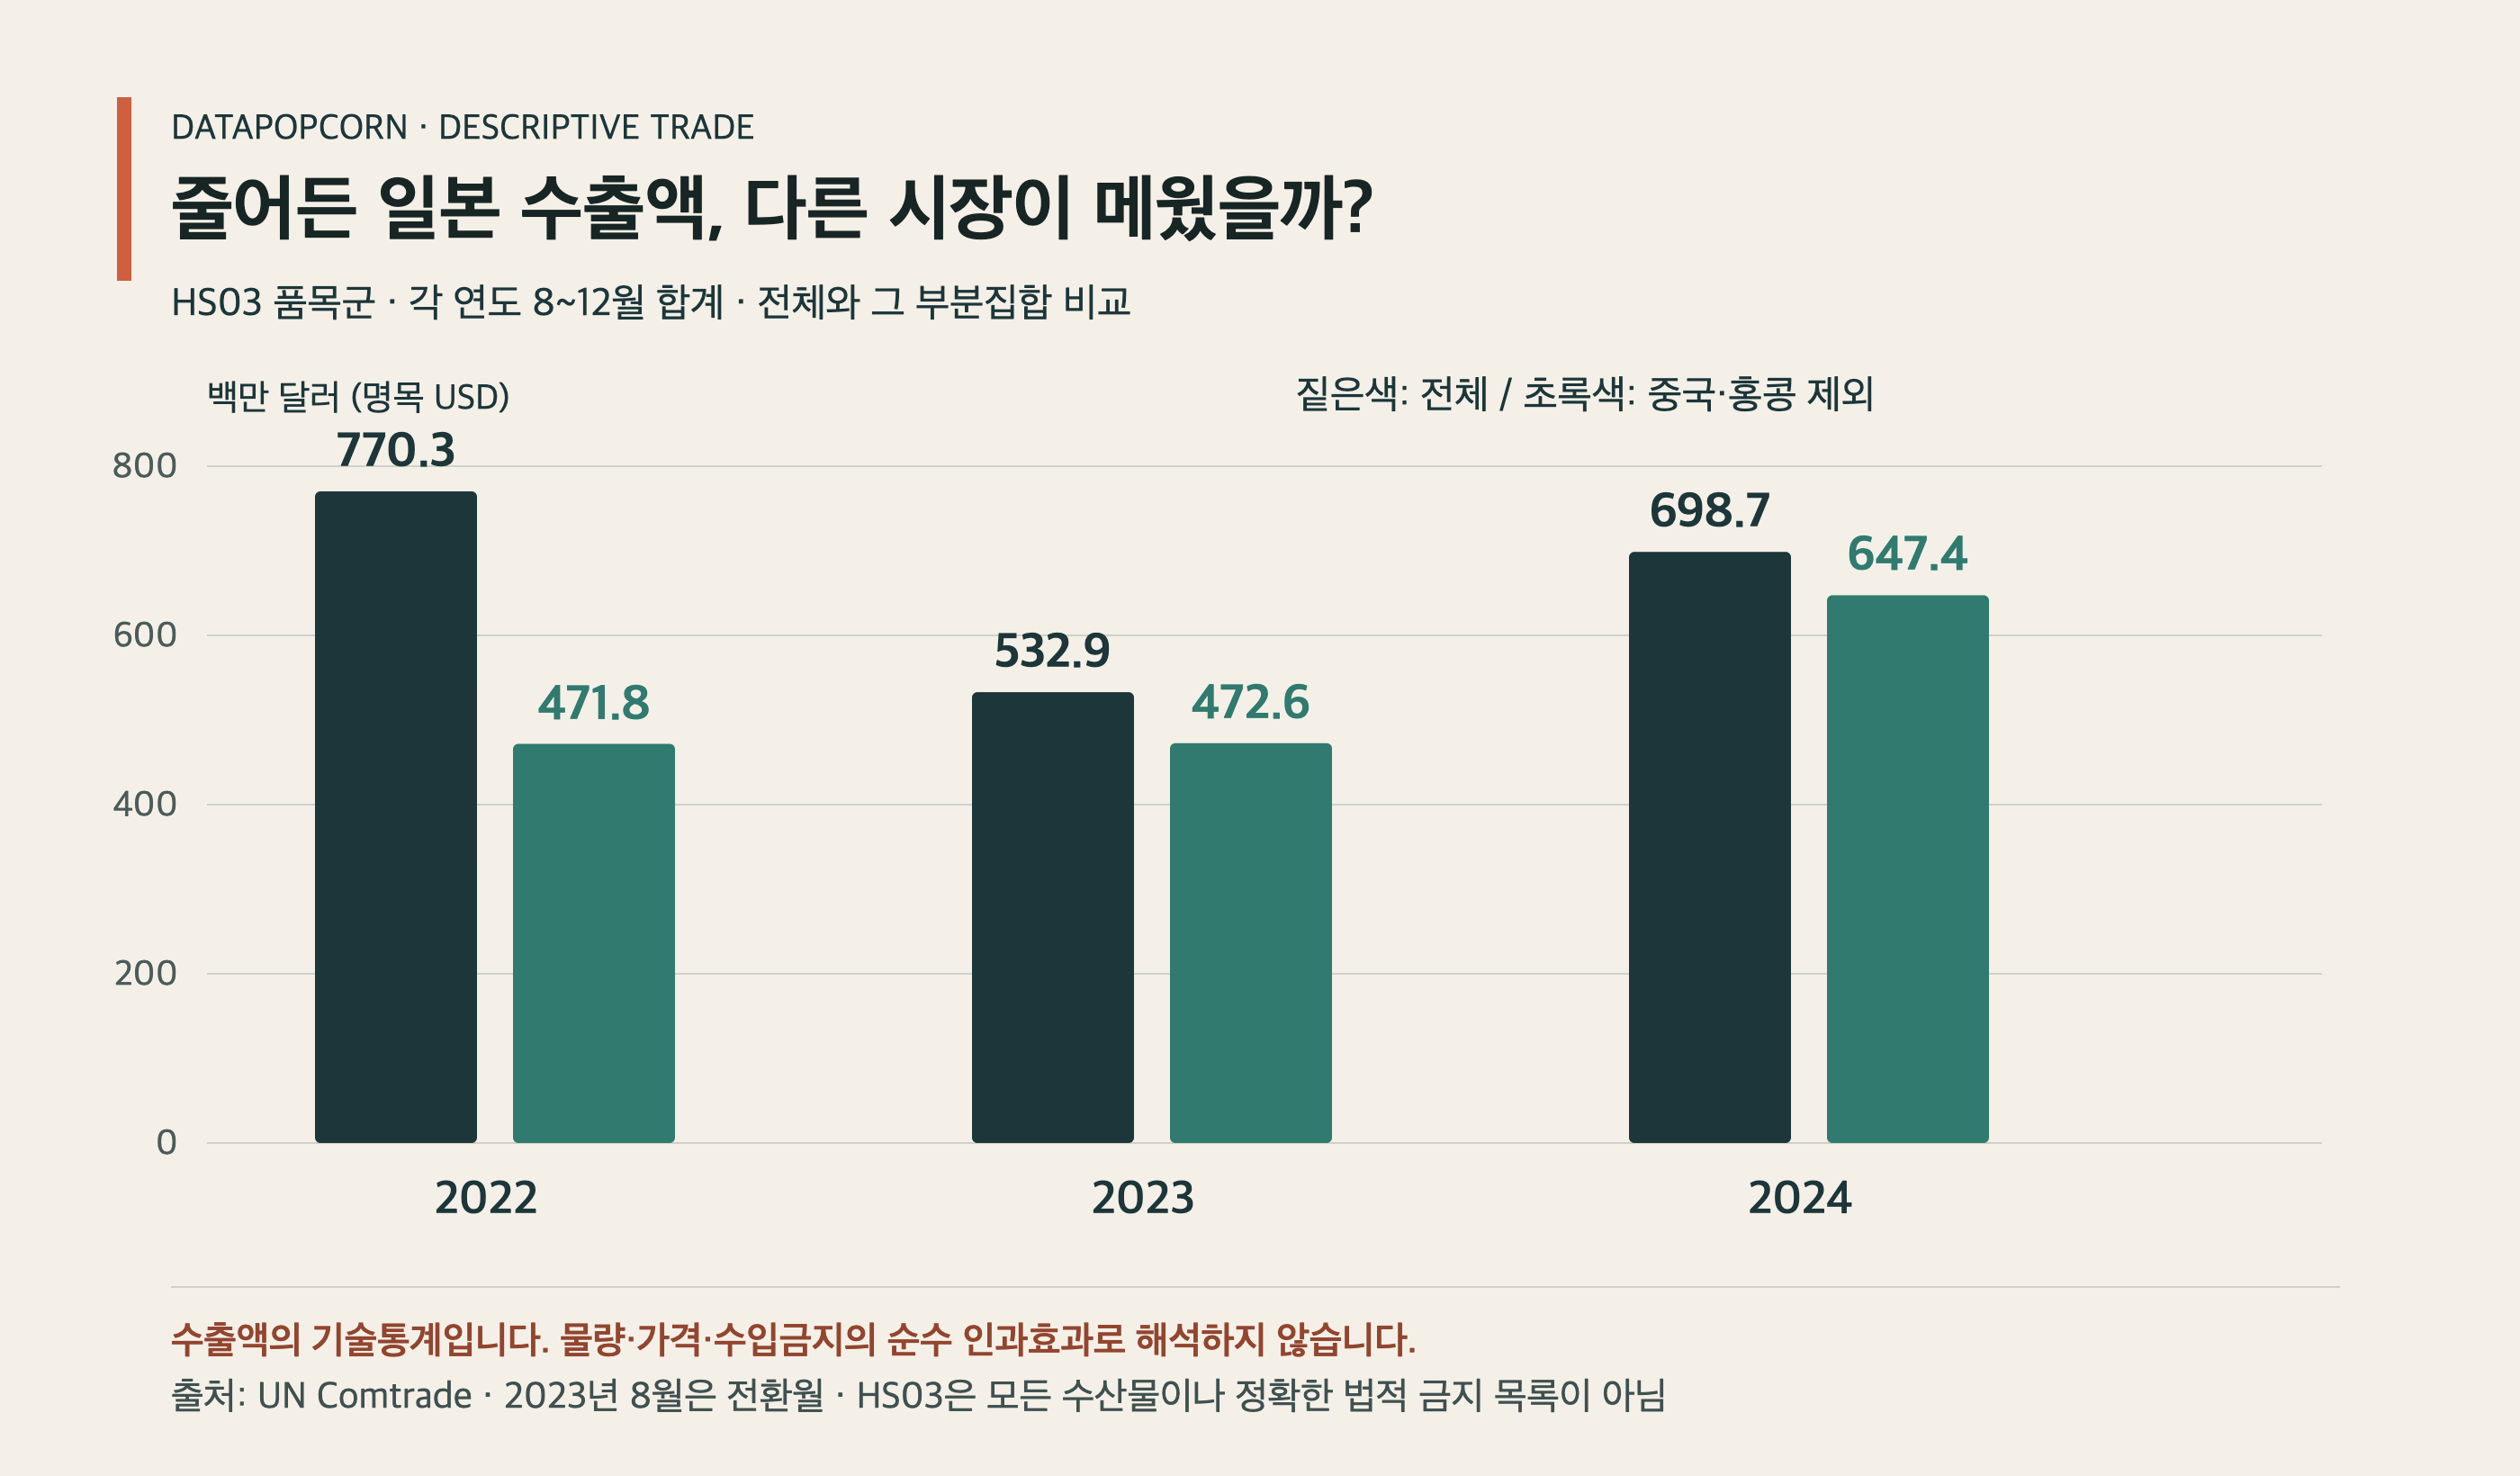
| World | $770.264m | $532.889m | -30.82% | Decline in world exports |
| China, reported rows only | $229.009m, 5/5 months | $18.769m, 4/5 months | Full-period rate not calculated | November 2023 missing |
| Hong Kong | $69.458m | $41.524m | -40.22% | 5/5 months observed |
| Destinations excluding China and Hong Kong | $471.797m | $472.596m | +0.17% | Descriptive statistic for early reallocation |
World compares five fully observed months each. China, on the other hand, has no row for November 2023, so there are only four months of reported values. Turning that gap into $0 would create a completely different claim: "exports to China were zero in November." So I did not calculate a five-month change rate for China, and recorded the reported subtotal and whether each row exists separately.
In a matched-month comparison, which keeps only pairs where the same month exists in both years, China fell 90.07%, from $189.054 million to $18.769 million on a four-month basis. This too doesn't plug in zeros for the missing value; it matches August, September, October and December 2022 with the same months of 2023. But this result also can't be read as the pure effect of a single legal measure.
"It was replaced" versus "it changed at the same time"
When exports to China fall and exports to other destinations rise, people often say "China's volume was replaced by the US or Vietnam." In trade, reallocation means a supplier redirecting existing volume to other markets. But the fact that exports to different destinations moved together doesn't let you trace where individual China-bound shipments went.
Causal identification would require examining what path each destination and world exports would have taken without the ban, whether comparison with other countries is possible, and whether price, product, logistics and exchange-rate shocks were the same. These results don't estimate such a counterfactual; they are before-and-after descriptive statistics. The 0.17% rise in destinations other than China and Hong Kong means that, at least in the first same-month window, there was no visible large-scale additional absorption overall. It is not evidence that the $200 million lost from China moved intact to other countries.
August-December 2024 paints a different picture. World was 9.29% below the same months of 2022, but destinations excluding China and Hong Kong were up 37.23% to $647.427 million. The US rose by $83.878 million, Vietnam by $53.201 million and Thailand by $33.709 million. This is consistent with destination diversification growing over time, but you can't count the 2024 rise as the causal replacement volume for China.
Why I checked a September window separately
Since August is the transition month that includes the effective date, it's intuitive to look at September through December on its own. The raw data and result files include comparison windows for January-July 2023 and September-December 2023. But the windows differ in length (7 months versus 4), so only monthly averages can be compared, not totals, and the seasonal comparison isn't perfectly matched either.
In the stricter same-month comparison of September-December 2022 versus September-December 2023, world exports fell 32.26%, from $612.367 million to $414.810 million. China fell 96.98% looking only at the three reported months common to both years, and destinations excluding China and Hong Kong fell 3.80%. The direction matches the August-December results, but a different comparison window gives different numbers. If you don't fix the analysis period and just pick whichever window looks biggest, conclusions get inflated easily.
Why I used only dollar export values
In the 2,012 rows of HS03 raw data, net weight was either zero or carried an estimation flag, so I couldn't build a reliable kg total. The main analysis therefore uses only nominal US dollar export values. This is the declared export value, not volume. It isn't adjusted for exchange rates or inflation, and it can also reflect changes in the mix of species, quality and processing, as well as changes in export prices.
So the right phrasing is not "export volume fell 30.8%" but "HS03 export value in nominal US dollars fell 30.8%." HS1604 and HS1605 do have separately valid net weight rows, but I didn't mix those figures with HS03 dollar exports. Combining indicators with different units into one total can produce a plausible-looking number that has lost its meaning.
Hong Kong can't be treated as a simple substitute destination either. From August 24, 2023, Hong Kong announced a full restriction on seafood from 10 Japanese prefectures and inspection requirements for products from other areas. So Hong Kong's -40.22% should be read as the change in a market hit by an external shock in the same direction as China, and it can't be used as a clean control group to fill in China's missing data.
71% for the second half, 14% for the full year
The same data produced two numbers because January-July 2024 was weak. Annual world exports in 2024 were $1,455.52 million, $493.96 million less than the $1,949.48 million in 2022. Destinations other than China and Hong Kong rose 6.5% for the year, from $1,259.80 million to $1,341.40 million, but most of that increase was concentrated in the second half. From January to June 2024, exports to destinations other than China and Hong Kong were actually 4-30% lower each month than in the same months of 2022, and from July 2024, about 11 months after the ban, they were 13-60% higher each month.
This gap is an important warning for anyone reading data. "Other markets filled 70% of China's gap" and "they filled only one-seventh" can both come from the same raw data, and which period you pick changes the conclusion. Any "replacement complete" claim that doesn't also show the full year deserves some skepticism.
Note that all of these values are in nominal US dollars. The yen was weaker in 2024 than in 2022, so even at the same yen price, the dollar value comes out smaller. Part of the -25.3% in world exports may be exchange-rate movement. Comparisons across destinations, however, face the same exchange rate, so the direction "other markets grew far less than China's decline" can't be explained by currency.
So where can you use this case?
If you're an exporter or policymaker, you can use it as a benchmark for checking dependence on a single market. In 2022, China and Hong Kong together accounted for 35.4% of Japan's HS03 exports. When that market closed, it took nearly a year for alternative outlets to grow noticeably, and on an annual basis most of it wasn't recovered. It puts numbers behind the idea that alternative outlets need to be built before a market closes, not after.
When you read news coverage, check which period a "replaced by other countries" report looked at, whether it's value or volume, and whether it also looked at the full year. Exports to the US, Vietnam and Thailand did increase, but that doesn't mean they filled China's gap.
For a more precise view, you'd need to look at HS 6-digit exports by species (scallops, for example), yen-denominated values and re-export routes after processing. A key question in particular is whether volume that used to be processed in China moved to processing plants in other countries.
Rules to follow when reproducing this
First, don't add World back into the destination list. Second, when a partner-month row is missing, leave it missing and don't replace it with zero. Third, don't call August 2023 the first complete post-ban month. Fourth, look at the same-month and matched-month comparisons first, and present 7-month versus 1-month or 7-month versus 4-month windows only as monthly-average reference figures. Fifth, don't mix nominal US dollars with kg.
I downloaded the raw data from the UN Comtrade public preview API and followed the UN Comtrade API documentation for dimension definitions. I checked the effective date against the announcement from China's State Council Information Office, and Hong Kong's separate measures against the Hong Kong government notice.
Raw data and reproduction code (ZIP)
The archive contains monthly country rows for HS03, HS1604 and HS1605 from January 2022 to December 2024, the request manifest, validation results, and analyze.mjs. Running the script on Node.js 18 or later recalculates the same-month totals for World, China, Hong Kong and destinations excluding China and Hong Kong, along with the missing-row checks. annual_offset.mjs recalculates the annual and August-December replacement ratios in the summary box without filling in missing values.